쿠버네티스 클러스터 모니터링의 핵심인 프로메테우스를 활용하여,
특정 파드가 CPU를 과도하게 사용할 때 알람을 발생시키는 실전 환경 구축 과정을 정리합니다.
1. 환경 구성 및 목표
시스템: Ubuntu 22.04 (Master 1, Worker 1)
스토리지: NFS 기반 nfs-client StorageClass 사용
핵심 목표: 파드 CPU 사용량이 **500m(0.5코어)**를 초과할 경우 알람 발생
2. Helm 차트 기반 프로메테우스 설치
# 프로메테우스 차트 저장소 추가 및 업데이트
helm repo add prometheus-community https://prometheus-community.github.io/helm-charts
helm repo update
마스터 노드에는 NFS 클라이언트가 없고 워커 노드에만 설치된 환경이므로, 파드가 워커 노드에 배치되도록 설정하는 것이 가장 중요합니다.
# custom-values.yaml

# Prometheus Server 스토리지 설정
server:
  global:
    scrape_interval: 15s
    evaluation_interval: 15s
  service:
    type: NodePort
    nodePort: 30090
  nodeSelector:
    kubernetes.io/hostname: test-worker
  persistentVolume:
    enabled: true
    storageClass: "nfs-client"
    accessModes:
      - ReadWriteOnce
    size: 10Gi
    mountPath: /data

# Alertmanager 스토리지 설정
alertmanager:
  nodeSelector:
    kubernetes.io/hostname: test-worker
  persistence:
    enabled: true
    storageClass: "nfs-client"
    accessModes:
      - ReadWriteOnce
    size: 2Gi

serverFiles:
  alerting_rules.yml:
    groups:
      - name: PodAlerts
        rules:
          - alert: HighCpuUsage
            # 500m(0.5) 이상 사용 시 알람 발생
            expr: sum by (pod, namespace) (rate(container_cpu_usage_seconds_total{container!=""}[1m])) > 0.5
            for: 10s  # 2분 동안 지속될 경우 알람 확정
            labels:
              severity: warning
            annotations:
              summary: "High CPU usage detected on pod {{ $labels.pod }}"
              description: "Pod {{ $labels.pod }} in namespace {{ $labels.namespace }} is using more than 500m CPU."
설치 및 업데이트 실행
helm upgrade --install prometheus prometheus-community/prometheus \
  -n monitoring -f custom-values.yaml
3. 주요 트러블슈팅: NFS 마운트 오류
설치 초기,
파드가 ContainerCreating에서 멈추며 bad option; /sbin/mount.nfs helper program 에러가 발생한다면 다음을 점검해야 합니다.

원인: NFS 도구가 없는 마스터 노드에 파드가 배치된 경우입니다.
해결: nodeSelector를 사용하여 NFS 라이브러리가 설치된 워커 노드에만 파드를 띄움으로써 해결할 수 있습니다.
4. CPU 알람 규칙(Alerting Rule) 추가
파드 단위의 실제 CPU 사용량을 계산하여 알람을 생성합니다.
serverFiles:
  alerting_rules.yml:
    groups:
      - name: PodAlerts
        rules:
          - alert: HighCpuUsage
            # 500m(0.5) 이상 사용 시 알람 발생
            expr: sum by (pod, namespace) (rate(container_cpu_usage_seconds_total{container!=""}[1m])) > 0.5
            for: 10s  # 10초 동안 지속될 경우 알람 확정
            labels:
              severity: warning
            annotations:
              summary: "High CPU usage detected on pod {{ $labels.pod }}"
              description: "Pod {{ $labels.pod }} in namespace {{ $labels.namespace }} is using more than 500m CPU."
5. 실전 알람 테스트 (CPU 부하 생성)
부하 생성 전용 파드를 배포하여 알람이 실제로 발생하는지 확인합니다.
부하 파드 생성
# cpu-load-test.yaml
apiVersion: v1
kind: Pod
metadata:
  name: cpu-load-test
spec:
  containers:
  - name: stress
    image: polinux/stress-ng
    args: ["--cpu", "1", "--timeout", "600s"] # 1코어를 100% 점유
    resources:
      limits:
        cpu: "1000m"
6. 알람 상태 확인 가이드
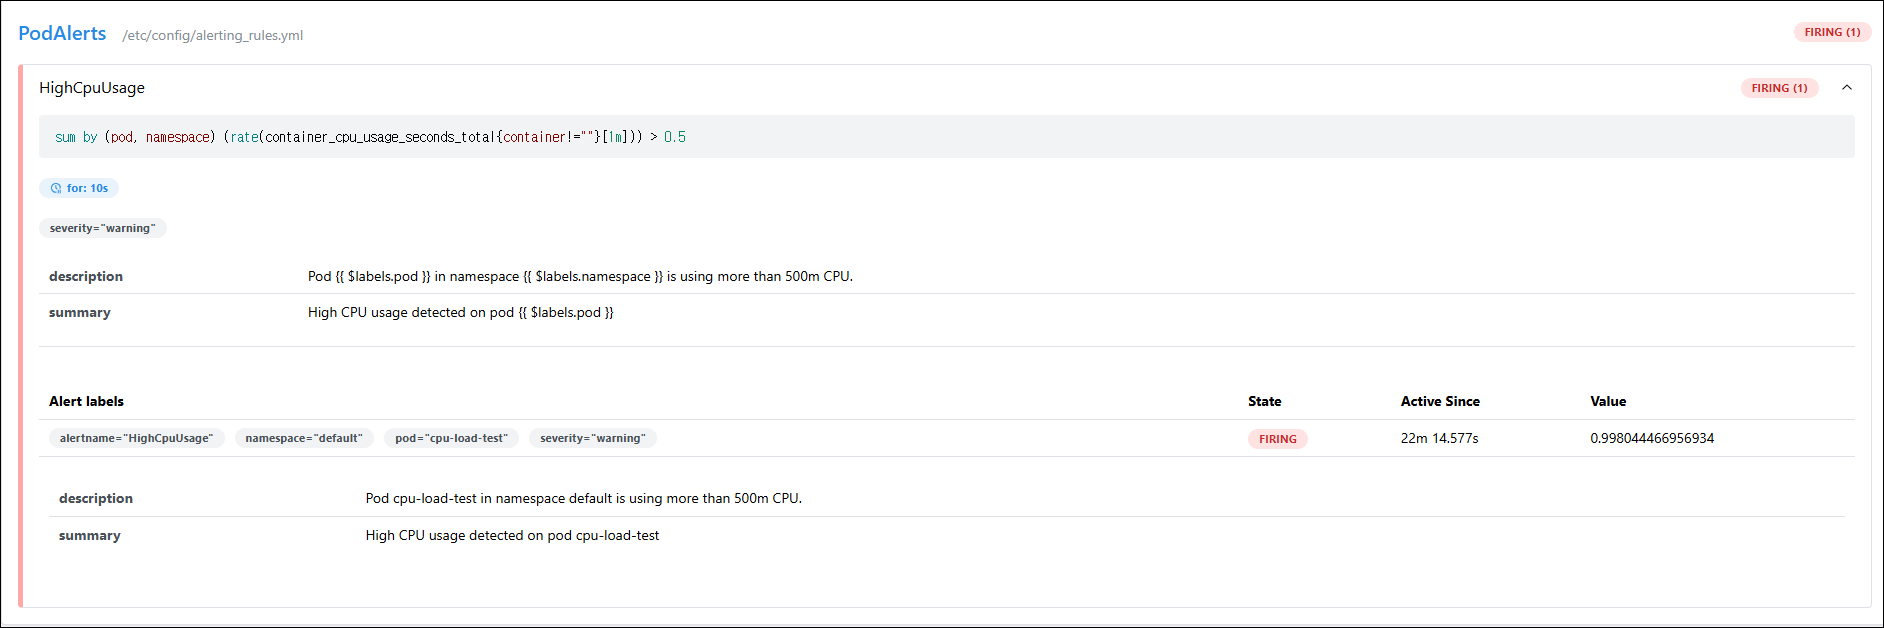
프로메테우스 UI의 [Alerts] 탭에서 알람의 변화 과정을 모니터링할 수 있습니다.
INACTIVE (녹색): 모든 것이 정상인 상태
PENDING (주황색): CPU 수치는 넘었으나 for: 10s 시간을 기다리는 상태
FIRING (빨간색): 조건이 최종 확정되어 알람이 발생한 상태!
마무리
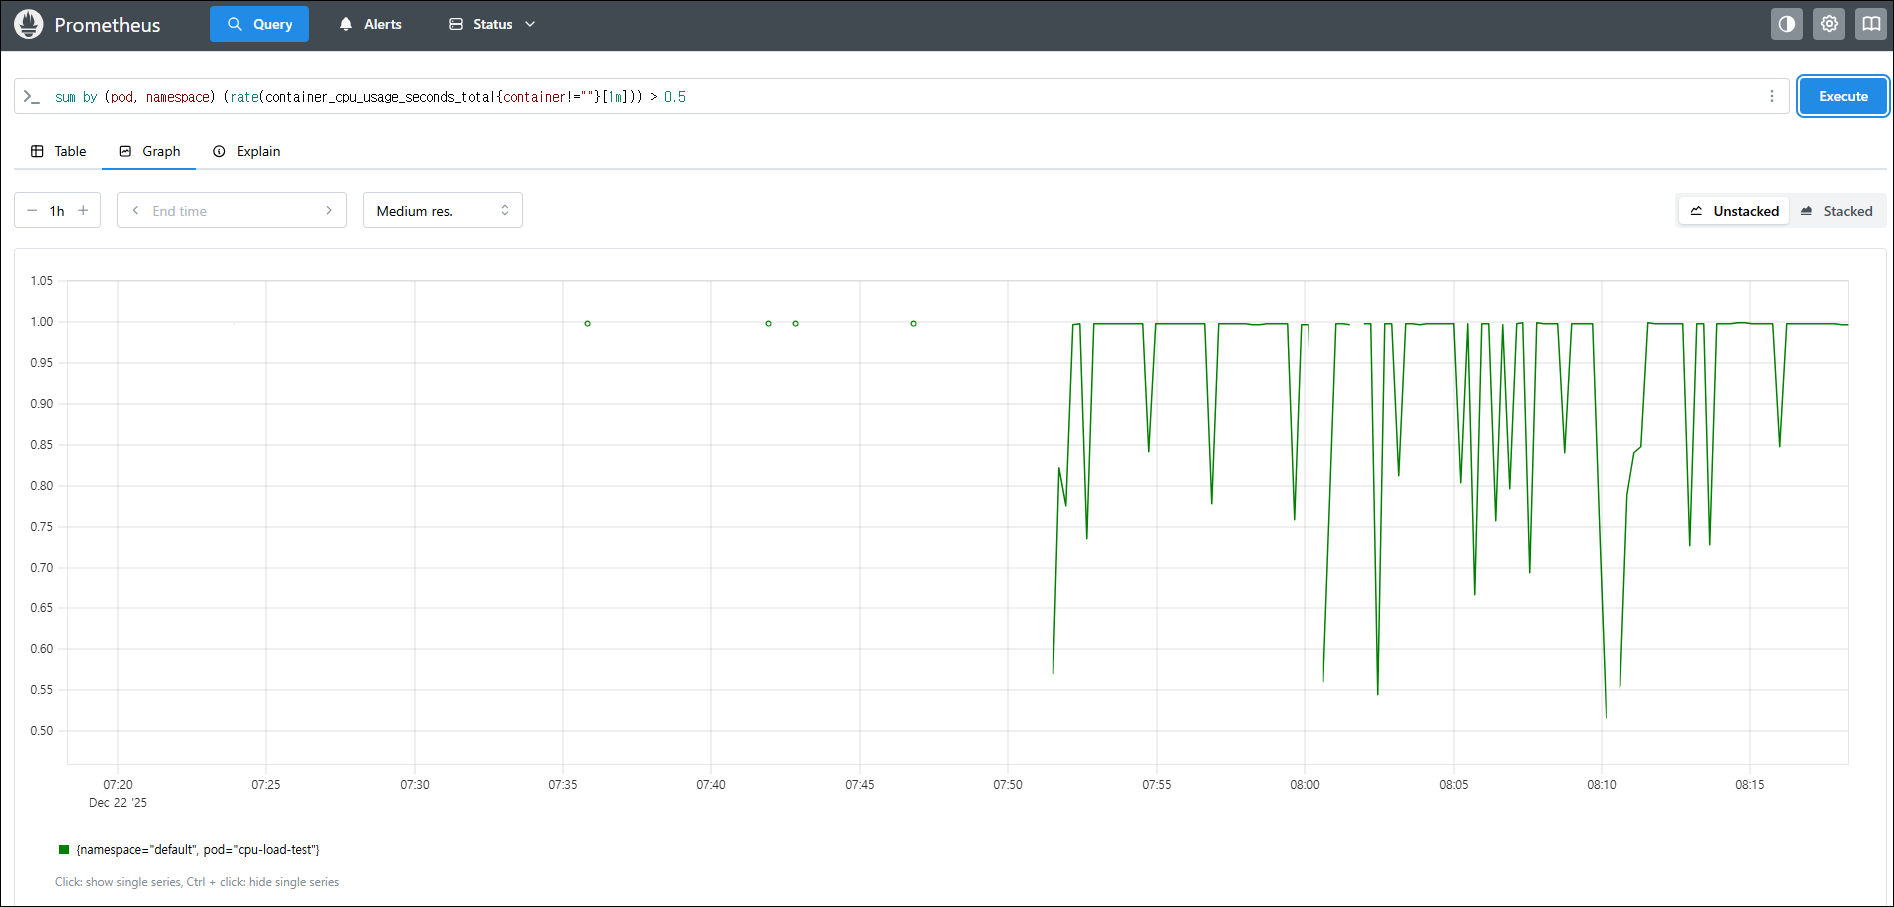
만약 알람이 계속 INACTIVE에 머문다면 프로메테우스 Graph 메뉴에서 해당 쿼리를 직접 실행해 수치가 0.5를 실제로 넘는지 먼저 확인하세요. 수치가 0.5 이하라면 테스트 파드의 부하 강도를 더 높여야 합니다.
Query 의 Graph 로 확인할 수 있습니다.
'Dev > DevOps' 카테고리의 다른 글
| Terraform (0) | 2025.04.24 |
|---|---|
| Ansible 실습 (0) | 2025.04.23 |
| Ansible (0) | 2025.04.23 |
| Kaniko (0) | 2025.03.10 |
| ArgoCD - gitea 연동 (0) | 2025.02.27 |


